Private Company Distress/Boring Radar v1
- Van Nguyen

- 1 day ago
- 4 min read
Updated: 2 hours ago

Companies House introduces the first set of changes under the Economic Crime and Corporate Transparency Act on 4 March 2024. Several things I found interesting about these changes is 1. The improvement in the quality of data and 2. Changes to the way people will have to fill their company account, this means all accounts filings made on and after 1 April 2027 must be filed using commercial software. With the purpose of continuous learning, never stop learning and always looking to acquire new skills, I decided to practice my programming skill through this interesting ideas of helping PE firms to create a radar to scan private companies and look for potential targets using this rich dataset. There will be two versions of this radar, the first version of the radar will just be using Companies House API to identify potential targets through their filling behaviours, the second version will be an upgrade where I will try to combine with fundamental analysis based on companies financial statements. In this post I will go over the first version.
The purpose of the first version is to spot UK private companies that might be:
at risk of financial distress, or
boring but reliably profitable
I divided this version into three stages: Foundation, Data Model and End-to-End distress radar workflow.
Stage 1 – Foundations (API + Data Collection)
I started by connect Companies House API using a personal API key. Using 'advanced-search' to build my universe, my universe as shown below:
1. Filter by SIC codes, this to identify and choose the cluster that I want, for example [70229, 70221, 73110]; here: 70229 means for Management consultancy (non-financial); 70221 means for Financial management and 73110 for Advertising agencies. Here is more information about the SIC code.
2. Filter by status, in this case I only chose Active companies.
After defined my universe, I fetched these information for each seed company:
1. Company profile
2. Filling history
3. Charges
Stage 2 – Data Model & Feature Engineering (Signals)
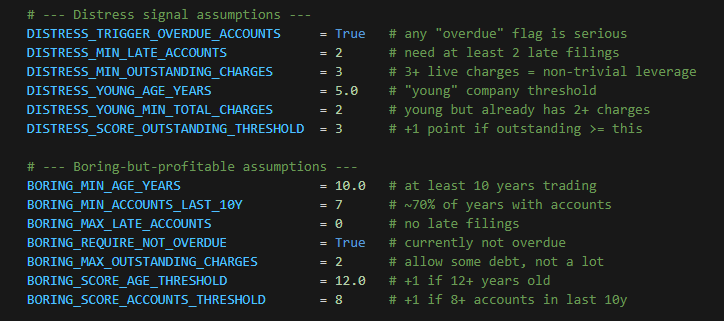
For stage 2, I started to build my model following these assumptions.
Distress signals | Boring but probably profitable signals |
Any “overdue accounts” flag is serious. Reason: If a company’s accounts are officially marked as overdue, I treat that as a red flag rather than a minor admin issue. | Currently not overdue. Reason: Their latest accounts also need to be up to date. A supposedly well-run firm shouldn’t be behind on basic compliance |
One late filing can be bad luck, two suggests a pattern. Reason: I only start worrying once a company has been late with its accounts more than once. The idea is to distinguish genuine operational problems from a one-off slip. | They file most years, not occasionally. Reason: Over the last 10 years, I expect them to have filed accounts in at least roughly 70% of those years. That points to a real, active business rather than a zombie company. |
Three or more live charges = meaningful leverage. Reason: If a company has several outstanding charges (security over its assets), I treat that as a sign of non-trivial debt/financing complexity, which can amplify distress risk. | No late filings. Reason: For this “boring and reliable” bucket, I require a clean filing record: no history of late accounts at all. |
“Young” companies are those under 5 years old. Reason: Younger firms are still finding their feet, so heavy use of debt early in life looks different to borrowing after decades of track record. | At least 10 years old. Reason: Longevity matters: a company that has survived a decade (and several economic bumps) looks more likely to be stable and profitable. |
Again, these are simple heuristics. The goal isn’t to perfectly classify every company, but to create two useful lists:
one of possibly stressed companies, and
one of “boring-but-probably-profitable” candidates that might be interesting to an investor or acquirer.
Here is the code for signals in python:
Here is the code for ranking in python:

Stage 3 – End-to-End Distress Radar Workflow (v1 Product)
For the final stage of this version, I wanted to summarise all the information, create 2 lists, on for potential distress companies and one for potential boring-profitable companies, and finally display the overall picture to the user. Below are quick summaries of the outcomes for 200 companies:
Distress score | Boring-profitable score |
count 199.000000 mean 52.763819 std 50.049465 min 0.000000 25% 0.000000 50% 100.000000 75% 100.000000 max 100.000000 | count 199.000000 mean 23.115578 std 36.491894 min 0.000000 25% 0.000000 50% 0.000000 75% 50.000000 max 100.000000 |
Potential distress companies


Potential boring-profitable companies

Errors and Limits
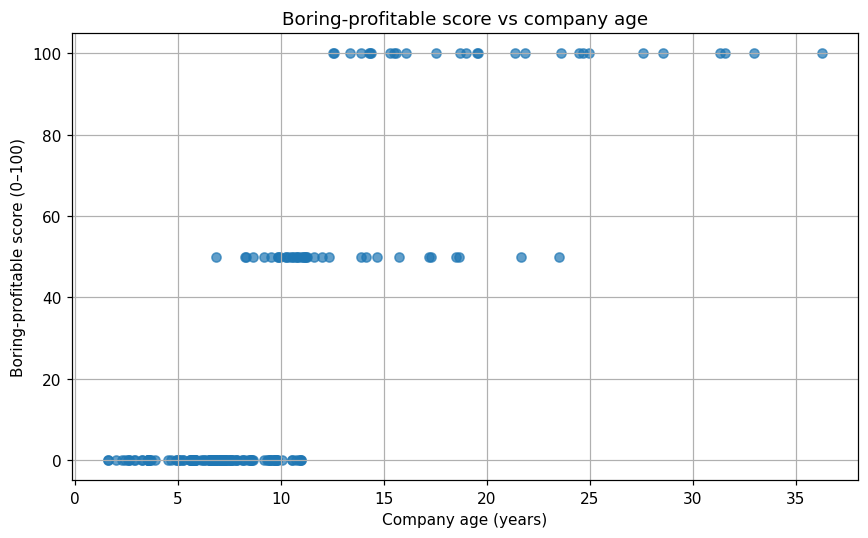
From the distribution of the potential distress companies, we can see there is only two groups, group one is 0-score and group two is 100-score, what this means is that my assumptions on distress companies signals were somewhat simple and thus we can not see any signification differentiation. The potential boring-profitable companies was a little better as I can see there are three groups, 100-score, 60-score and 0-score groups, this is due to the my assumptions to rate companies with different scores based on their age.
The other limit is the amount of data in this experience, Companies House only allow user to fetch 600 requests every 5 minutes, and therefore this dataset is only 200 companies since I fetch three-information (Company profile, Filling history and Charges) for each company as described in Stage 1.
Improvements for Version 2.0
Even though this model is far from my aim, the output still give me some interesting information, such as the age of these companies, how many times they fill their documents late, etc. Since this is just the testing stage for API Companies House, it limits the amount of data that I could use to test this model. I believe with larger dataset, this model will provide more insights and helpful information for PE firms. Further improvements could be changes to the assumptions, changes to the SIC codes or connect to their financial statements. However, the question is how can we do it a 'big-data' scale? I will answer this question in my version 2 radar.
What do you think? Leave your thoughts in the comments below.
Please find more details about the code in my GitHub account here


Testing this.